Why Choose FlexClip's Online Column Chart Maker?
Free to Use
Our column chart maker 100% free to use, allowing column chart making without any cost.
Preview in Real Time
Import your data from various sources and watch how our column chart maker visualizes it in real time.
Flexible Output Format
Embed your interactive column chart in your video or download it as GIF or a static PNG.
please input title
Three Types of Column Chart with Animation
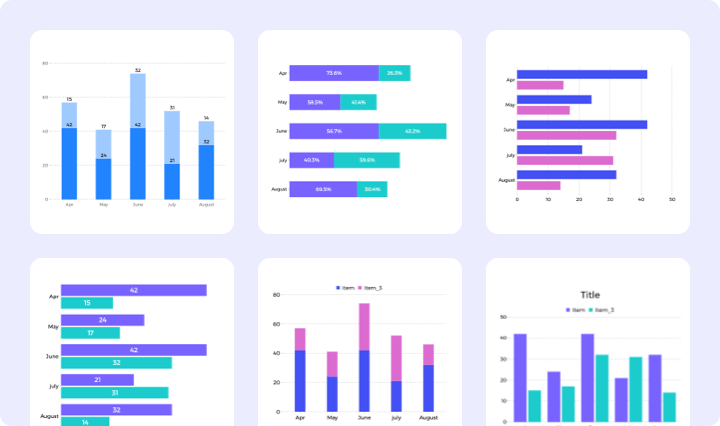
Whether your data is simple or complex, FlexClip has a column chart type for you. Use a single column chart to illustrate value changes over time, a grouped column chart to highlight differences among several categories, or a stacked column chart to compare total values across categories. Choose one to visualize your data effectively.
Create a Column Chart
Customize the Column Chart as You Need
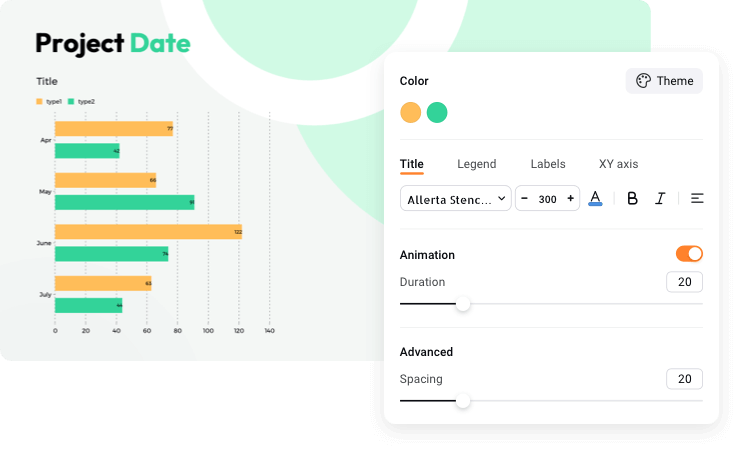
Customize the column chart as the way you like. You can adjust the theme color, select label styles, set animation duration, change the title font, shift values to percentage scales, and more. With FlexClip’s free online column chart maker, creating a personalized column chart is a breeze.
Customize a Column Chart
Beautiful Chart Templates for Inspiration
If you're looking for ideas, we provide a variety of chart templates to help you get started easily. Simply choose a column chart template you like, replace the preset data with your own, and customize it to fit your preferences.
View Column Chart Templates
Visualize Data Across Multiple Industries
Support your claims and facilitate clear data comparisons, making complex information easy for viewers to understand at a glance. Whether analyzing competitive products, financial statements, medical examination reports, or any content that uses data to highlight trends or comparisons over time, FlexClip can deliver impressive results.
Create a Column Chart
How to Create a Column Chart Online for Free?
- 1
Choose a Type & Enter Data
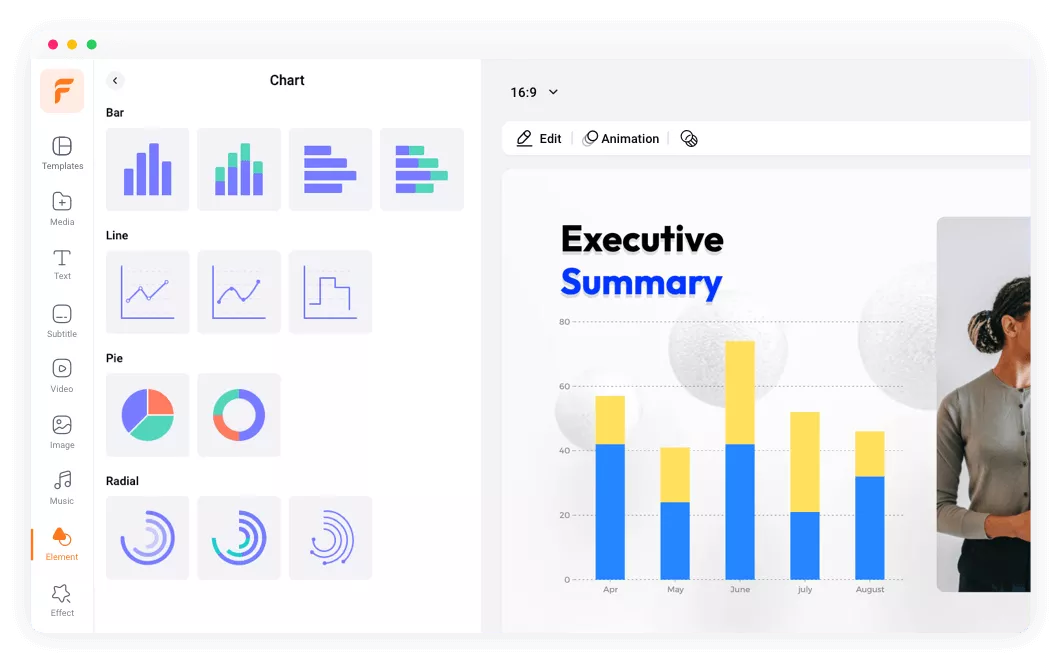
Open FlexClip, choose a column chart template you like, and either enter the data manually or import it from your computer.
- 2
Customize the Column Chart
Personalize colors, titles, duration, and other settings to align with your brand.
- 3
Download the Column Chart
Download the animated bar chart as a video, GIF or a static PNG, Alternatively, you can keep using it to create additional designs.

Frequently Asked Questions
1.How to make a column chart in Excel?
If you want to insert an animated column chart using data from your Excel file into a comparison or analysis video, you can easily do so with FlexClip.
