Free Online Animated Chart Maker
Visualize your data with animated charts and graphs.

Why Choose FlexClip to Make Charts and Graphs

Free to Use
Our chart maker is free to use. You can access all charts without any cost.

Animation Support
Create animated charts that display changes over time, enhancing your visual storytelling.

Real Time Preview
Import your data from various sources and instantly preview how your chart or graph will look.
please input title
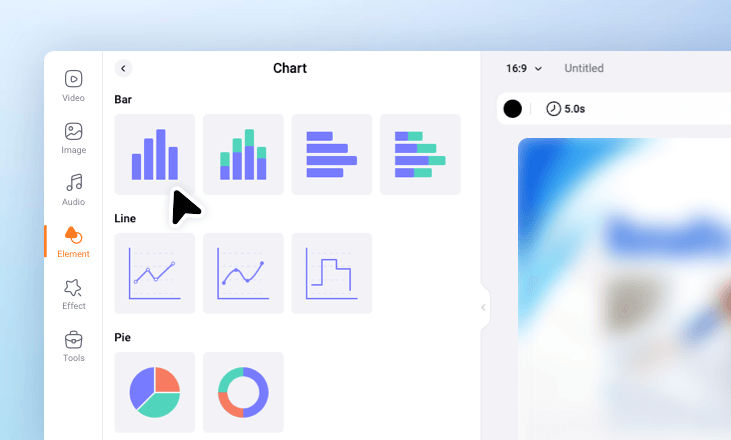
Various Types of Charts and Graphs with Animations
Choose from bar graphs, column graphs, line charts, pie graphs, donut graphs, radial charts, area charts, and funnel graphs. These options make your data reports visually compelling and easy to understand.
Create a Chart Now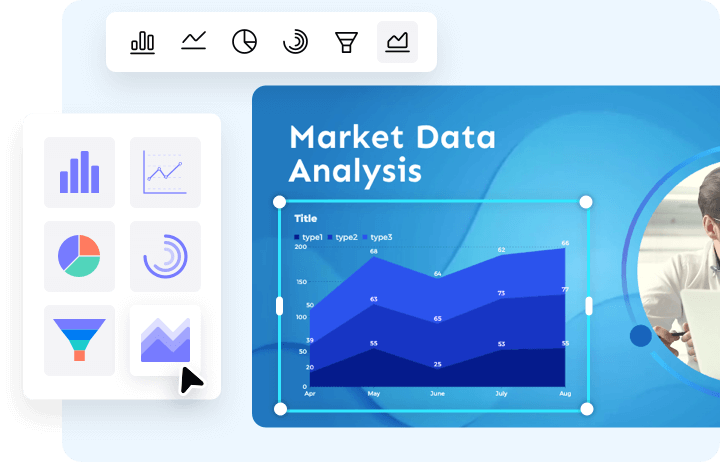
Customize Charts to Meet Your Needs
Customize the chart to match your brand visual identity. You can change the color schemes, adjust the text styles, layout, animations of title, legend, label, axis, and make more adjustments at will.
Create a Chart Now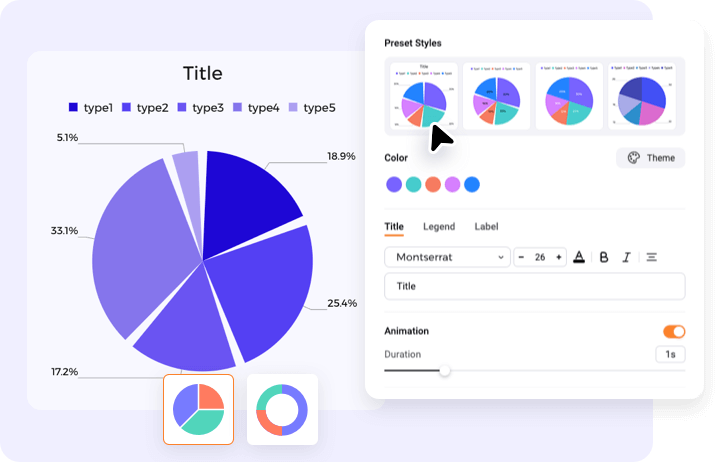
Inspired with Customizable Data Visualization Templates
No idea where to start? Explore our wide selection of templates to jump-start your project. Simply choose a template and import your data to replace the default content. All template elements can be fully customized to suit your preferences.
View Templates Now
Embed Chart to Your Design Effortlessly
Easily add charts to reports, infographics, or presentations to display data clearly. Help viewers understand trends and stay engaged with visually appealing content.
Create a Chart Now
How to Create a Chart Online for Free?
- 1
Enter Data
Open a graph, type your data manually or import data from sheet.
- 2
Customize Chart
Choose the chart type and style, customize it if you want to change colors, text, duration and other settings, then add it to the canvas.
- 3
Download the Chart
Download the animated chart as a video or GIF, or continue use it to create more designs.