Why Choose FlexClip's Free Online Bar Graph Maker?
Free to Use
Our bar chart maker is available for free, allowing you to create stunning bar graph designs with just a few clicks.
Animation Support
Enhance your data storytelling by animating what you want to emphasize and showcase, requiring no skills.
Preview in Real-time
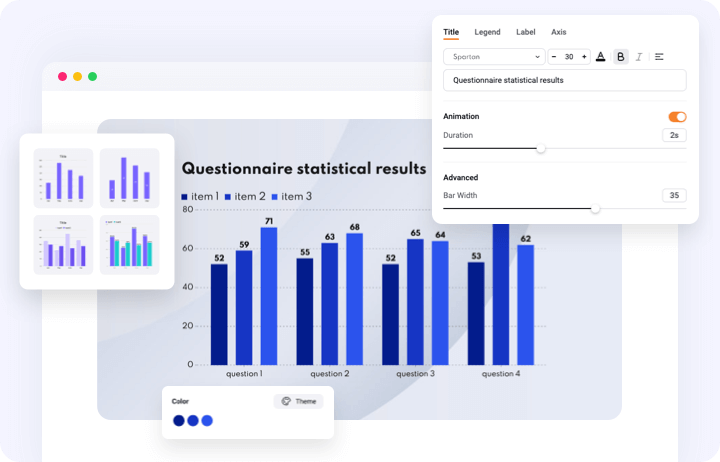
Any parameter you can preview in real time while editing, including the title, lable, legend, and more.
please input title
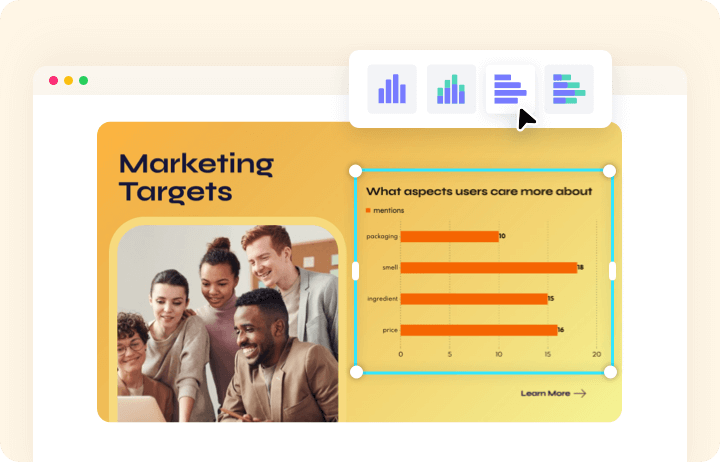
Three Types of Bar Graph for Customization
Vertical, horizontal, and stacked bar graphs effectively showcase categorical and numeric variables. Vertical graphs compare data over time, horizontal graphs excel with long labels, and stacked graphs highlight totals and trends. Choose one to customize easily.
Create a Bar Chart Now
Create On-Brand Progress Bar Graph
FlexClip’s free online bar graph maker is user-friendly and versatile, letting you customize the X-axis, Y-axis, title, labels, legend, colors, animation duration, bar width, and fonts. Create a cohesive brand identity and gain insights for decision-making without any skills. Just type in your data or import files for easy edits.
Create a Bar Chart Now
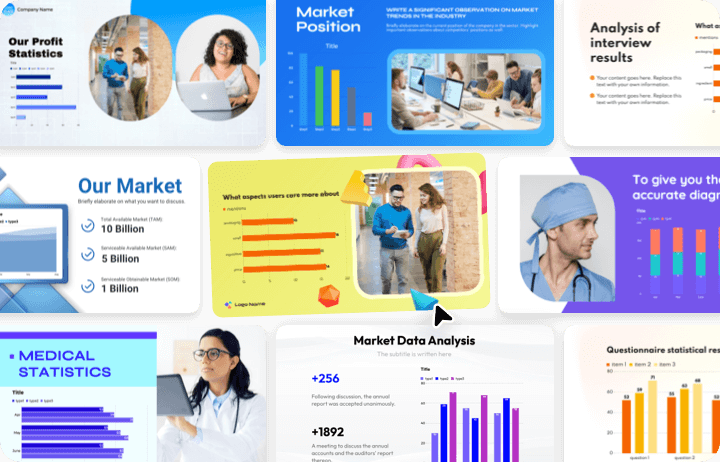
Bar Graphs Across Various Industries
Informed decisions and innovation rely on clear, professional bar charts, especially for presenters in healthcare, finance, and retail. This strategy boosts efficiency and collaboration, resulting in better outcomes for companies and clients.
Create a Bar Chart Now
How to Create a Bar Chart Online for Free?
- 1
Choose a Type & Enter Data
Select one from vertical, horizontal, or stacked bar graphs to add data manually or from your computer.
- 2
Customize Bar Chart
Personalize colors, titles, duration, and other settings to align with your brand.
- 3
Download the Bar Chart
Download the animated bar chart as a video or GIF, or keep using it to create additional designs.

